For investors who have been investing for some time know that it is quite normal to see market declines from time to time yet it doesn’t make it any less unsettling to live through. We’d like to share with you some data from JP Morgan Asset Management to help put the recent market volatility in a longer-term perspective.
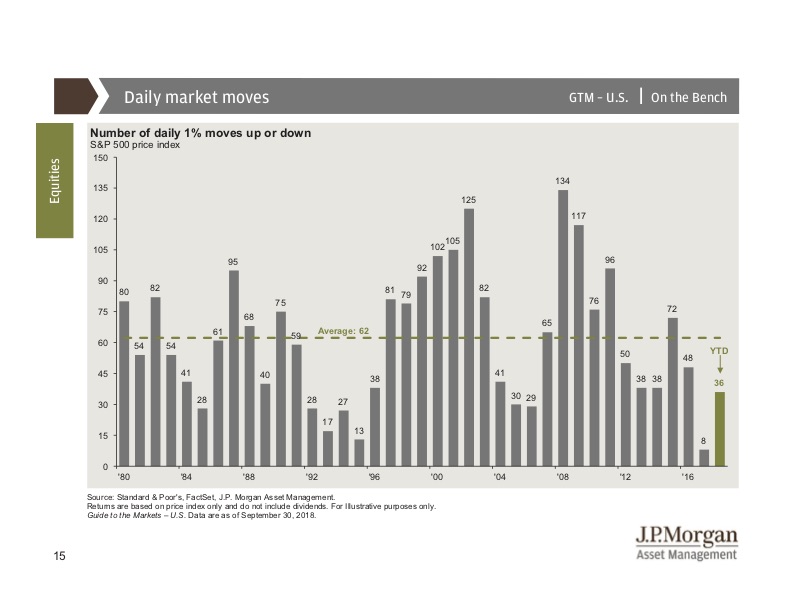
This slide shows the S&P 500 Index over a 38-year period from January 1, 1980 to September 30, 2018. Keep in mind that the S&P 500 is not an actual investment but rather an index which tracks a group of stocks and is used just as a representative of the overall stock market. Each of the gray lines on the chart represents the different years, with the numbers at the top of the lines representing the number of times within that year, the S&P 500 declined by more than 1%. For example, the market was down more than 1% in one day eighty times in the year 1980, while 2017 was a relatively quiet year, having only eight of such declines within the year. So far this year, as of September 30th, we had 36 declines of more than 1% per day. If you look at the year 2009, these declines of 1% or more happened 117 times, yet the total return for that year was 18.82%. It’s important to remember that short-term volatility is very normal and it is important to maintain focused on the long-term.
Now some investors feel they just can’t stomach the recent volatility we have seen, are concerned about a possible correction, and have asked us to move out of equities. Of course, we certainly understand this type of emotional reaction and the difficulty of weathering through volatility. However, history shows us that some of the largest market gains we have seen have often come after some of the worst days in the markets. The chart below shows the impact of being out of the market during those times.
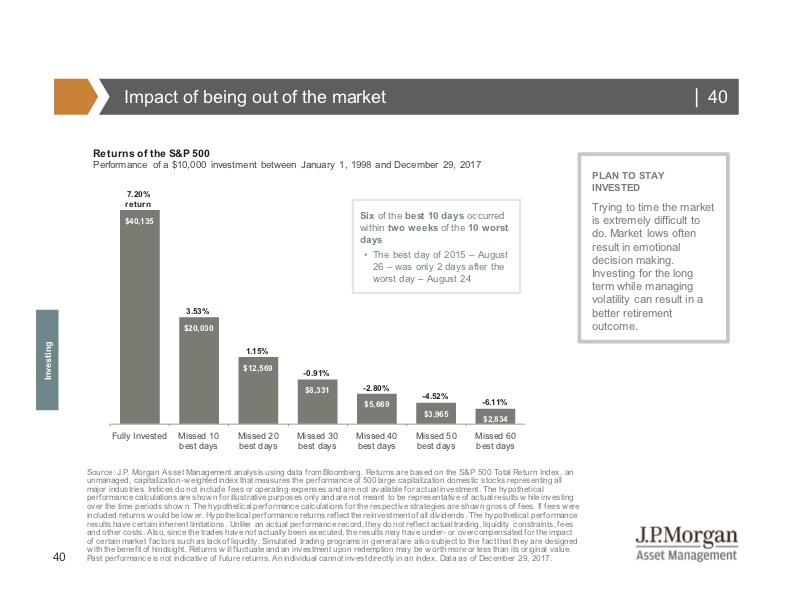
This chart shows a $10,000 investment made on January 1st of 1998 and held until December 29, 2017. Keep in mind, the late 1990’s was the height of the dot.com era so an investment over this period would have weathered through not only the burst of the dot.com bubble, September 11th, the war in Iraq/Afghanistan, and the 2008 financial crisis. An investor who remained invested over that period of time would have seen his/her account value grow to $40,135, an average annual return of 7.2%. If they were to miss just the 10 best days in the markets over that same period of time, their return would have only been an average annual of 3.53%, less than half as much. Missing the best 20 days would reduce their average annual return to only 1.15% – only 20 days out of 20 whole years! And if they missed the best 30 days, they would actually have a negative return over those 20 years. This is why we so strongly encourage our clients to remain invested through volatile times. We know it is not easy but statistics consistently show that trying to time the market (either when to get in, or when to get out), never works.
The next chart shows us annual returns vs. intra-year declines and how volatility within the year does not necessarily mean the entire year is a loss.
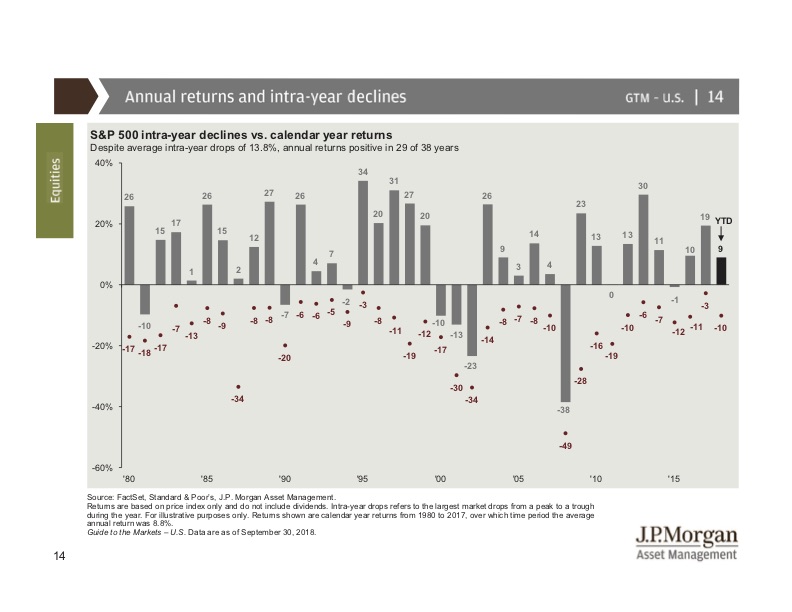
Again, we are looking at the S&P 500 Index since 1980 and each gray bar represents one year. The number at the top of the bar shows the annual return for that year while the red dot at the bottom shows the percentage by which the market was down at some point during the year. The 38-year average intra-year decline is 13.8% per year, yet the annual returns were actually positive 29 out of 38 years. Only nine years out of the 38 years did the market actually end in negative territory. Does this mean we won’t end up in the negative this year? Of course, we can’t predict from one year to the next.
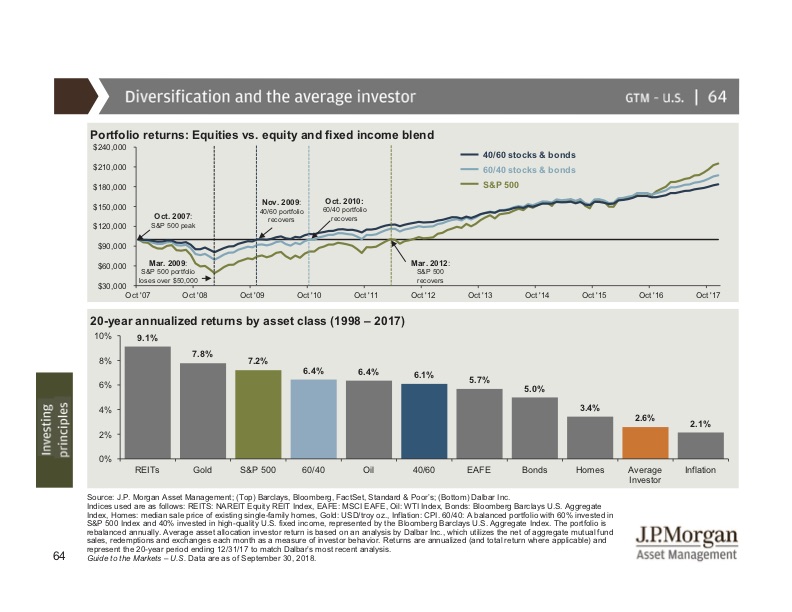
The next chart shows research done by Dalbar on the Average Investor returns, based on investor patterns in fund purchases, redemptions, and exchanges, compared to investment returns of various asset classes if they were purchased and held for a 20-year period from 1998 to 2017. Each of the bars represents different asset classes, including REITs (real estate), Gold, S&P 500 (US stocks), and Oil. The 60/40 and 40/60 portfolios represent the allocation of stocks to bonds. Of all asset classes over this period, the average investor fared worse than all of them, only slightly edging out inflation. This is typically because the average investor is trying to time the market, often selling when the price drops and buying back after it has already recovered. Again, this is why we encourage our clients to step back and take a longer-term view of the equity markets.
We’ve been asked if the current volatility we are experiencing is indicative of the beginning of a bear market or if that is something that will come further down the road. To be quite honest, there is just no way to know. We do feel the fundamentals of the US economy from a purely statistical perspective remain strong. At the same time, we know the market has been on a steady climb for nine straight years and we know it doesn’t go up forever. Whether a larger market correction is going to happen soon, next year, the year after, or if the current volatility is all we are going to see, we simply can’t say. What we do know, however, is that we tailor our clients’ investment portfolios based on their goals, risk tolerance, levels, and time horizon so that they are positioned to navigate through various market cycles to try and achieve their personal goals. And assuming those goals and risk tolerance levels have not changed, we do not believe short-term changes to a portfolio are warranted in times like these. We recommend staying the course and as always, if you have any questions about your portfolio, feel free to reach out to your financial advisor.
__
The data provides was gathered from sources believed to be reliable, however, it cannot be guaranteed. Investing involves risk including the potential loss of principal. No investment strategy can guarantee a profit or protect against loss. Past performance is not guarantee of future results. This material may contain forward looking statements and projections. There are no guarantees that these results will be achieved.
Securities and Advisory services offered through Osaic Wealth, member/FINRA. Traditional/Fixed insurance offered through Kramer Wealth Managers, which is not affiliated with Osaic Wealth. Neither Kramer Wealth Managers nor Osaic Wealth offers tax or legal advice. Branch offices: 9099 Ridgefield Drive, Suite 101, Frederick, MD 21701 | 240-439-6889 (VP) | 240-39-6929 (V) 611 S. Congress Ave. Suite 440, Austin, TX 78704 | 512-410-0739 (VP/V)